
A Highly Available Service Mesh at WePay
In the last two posts in this series, Using Linkerd as a Service Mesh Proxy at WePay and Sidecar and DaemonSet: Battle of containerization patterns, we had some fun digging deep into some of the more specific parts of a service mesh, service mesh proxy (Linkerd) and the containerization patterns for these proxies, respectively.
In the third part of the series, we’re going to look at the service mesh system at a higher level. Specifically, we’re going to look at service mesh’s health in terms of monitoring and alerting, and how we use each set of data to define highly availability for the service mesh setup in WePay’s infrastructure.
The overall picture
As with the other service mesh setups we’ve talked about in the series, we’re going to look at a highly available and modularized service mesh running in Kubernetes on Google Kubernetes Engine (GKE).
We’ve gone through a few iterations of designing the service mesh architecture, and the setup that worked best for our requirements and needs was a modularized one. In our modular design, the service mesh data plane or proxies (Linkerd), and the service discovery or control plane (Namerd) are split into two separate modules to make maintenance and monitoring easier. In this service mesh architecture, services can discover each other using Namerd, and route requests to one another using Linkerd, In addition to load balancing and metrics.
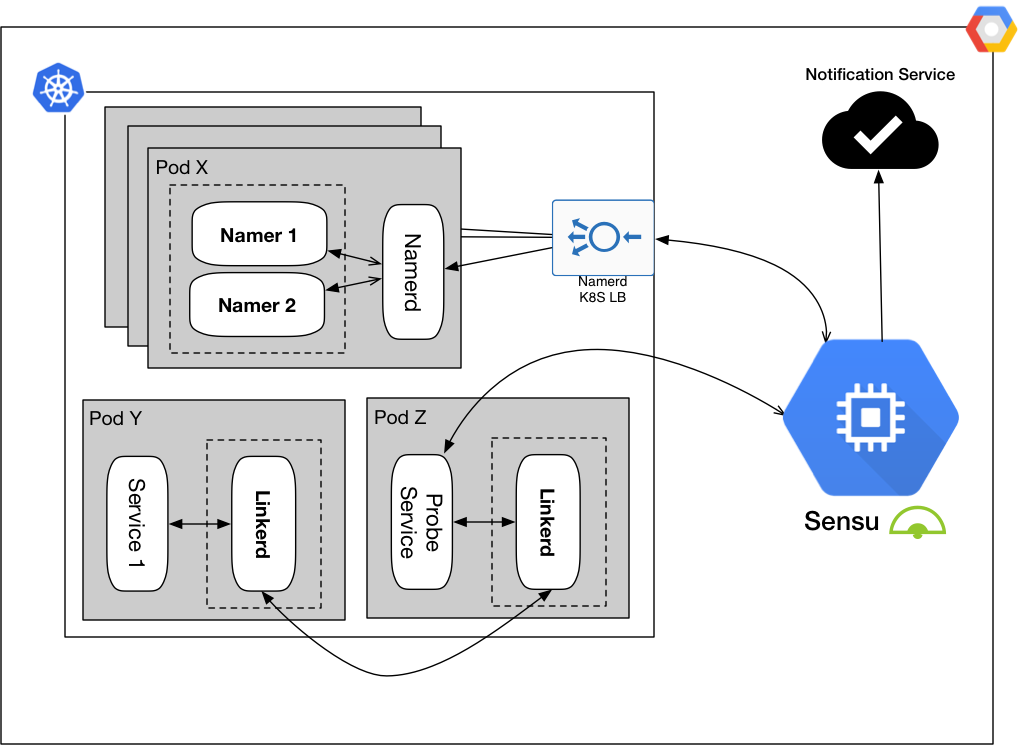
Figure 1: Service mesh modules are Namerd service and Linkerd proxies
Figure 1 shows Namerd and Linkerd as the modules for enabling service mesh in WePay’s infrastructure, and WePay’s Sensu setup as the centerpiece that gives us the ability to watch the service mesh system for any issues, and alert when something doesn’t act normally.
As mentioned earlier, in this post we’ll focus on how this simplification along with the monitoring tools at hand has led us to a highly available service mesh system. We’ll also go into details about what’s involved in monitoring the system, and look at what is considered normal or abnormal operation for the system.
ABC’s of service mesh monitoring
The last section explained how we simplified our service mesh architecture with clearly defined modules. Using that architecture, we spent some time identifying what monitoring means for each module in the system, and then the entire system as a whole. We simply wanted to answer the question, “How do we monitor the system with the best visibility into issues, and what do we alert on?”
By answering these questions, we have uncovered and improved various parts of the system. For example in our proof-of-concept phase, we initially started off with a solution where Namerd was a sidecar to Linkerd in Kubernetes. Once we decided that it would be a better practice for these two services to have their own lifecycle and health checking definition, we moved Namerd to a cluster behind HAProxy with backends built out of Google Compute Engine instances. Then, after various iterations, we refactored Namerd into a Kubernetes service, where it’s exposed to Linkerd proxies through a Kubernetes load balancer.
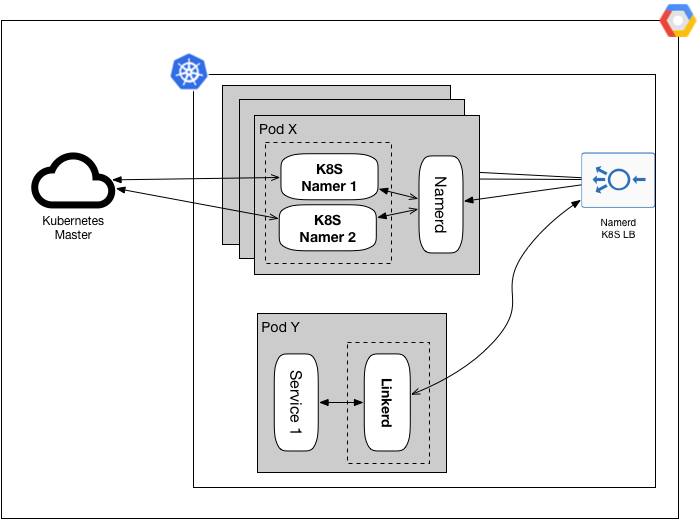
Figure 2: Service mesh stack with discovery through K8S namers
In Figure 2, Namerd is replicated in a Kubernetes cluster, Linkerd proxies talk to it through its Kubernetes load balancer, it runs Kubernetes proxies as sidecar containers to watch changes to each Kubernetes cluster, and each Kubernetes proxy talks to its master to report cluster changes back to Namerd.
This is only one example where identifying the proper scope for each module has tremendously simplified both monitoring and lifecycle of the services in our service mesh system. After identifying the scope for each module, we tested them against our high availability requirements for the modules in the system:
- When possible, the system should self-heal.
- The monitoring system must be able to report both the internal and external health of each module in the system.
- Improve the system to self-heal as much as possible, and alert when self-healing is not applied or is not possible to implement.
The following sections go over some of the important monitoring pieces for each of the Namerd and Linkerd modules. We also get into the details of the tools we have implemented to achieve external and internal visibility from each of our Google Cloud projects and Kubernetes clusters, respectively, in terms of monitoring and alerting.
Service discovery, A-OK
Service discovery is an important part of a service mesh system, and for us is a crucial service in our infrastructure, given how many services it discovers in each of our data centers. Any disruption in discovery can affect routing, and if the disruption is extended to minutes, it can bring down routing for all services that discover each other using service mesh. So how we monitor discovery using Namerd depends on the heartbeat of Namerd itself, and the health of the proxies, shown in Figure 2, that report changes to the service endpoints to Namerd.
Discovery service’s heartbeat
As the discovery service for service mesh, Namerd is watched for internal health at each of its instances. One of the main reasons why we moved Namerd to Kubernetes was to get better healing and monitoring, inline with how we monitor and watch all of our microservices running in a data center.
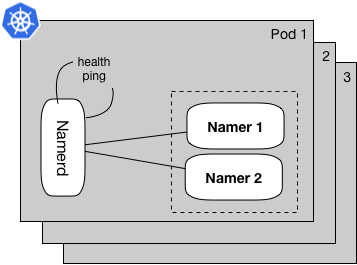
Figure 3: Namerd internals with Kubernetes health probe
Taking a closer look at Namerd’s replicas in a Kubernetes environment, Figure 3 shows N replicas for the service in a cluster. Each replica is watched by Kubernetes’ scheduler to ensure exactly N live replicas. In addition, each replica is configured to get pinged using Kubernetes’ health scheduler over a short interval, e.g. every few seconds, to gauge responsiveness. If any of these checks are unsuccessful or fail to respond, the affected replica is restarted. As a result, the replica starts up fresh and re-binds with its configured namers.
In addition, we might run into situations where all replicas are affected at once. In such situations, we get notified about a full downtime for Namerd by setting up a higher level heartbeat. This heartbeat is external to Kubernetes and seeks for at least one healthy and available backend behind Namerd’s Kubernetes load balancer. We achieve this by using our Sensu system’s check runners in the data center.
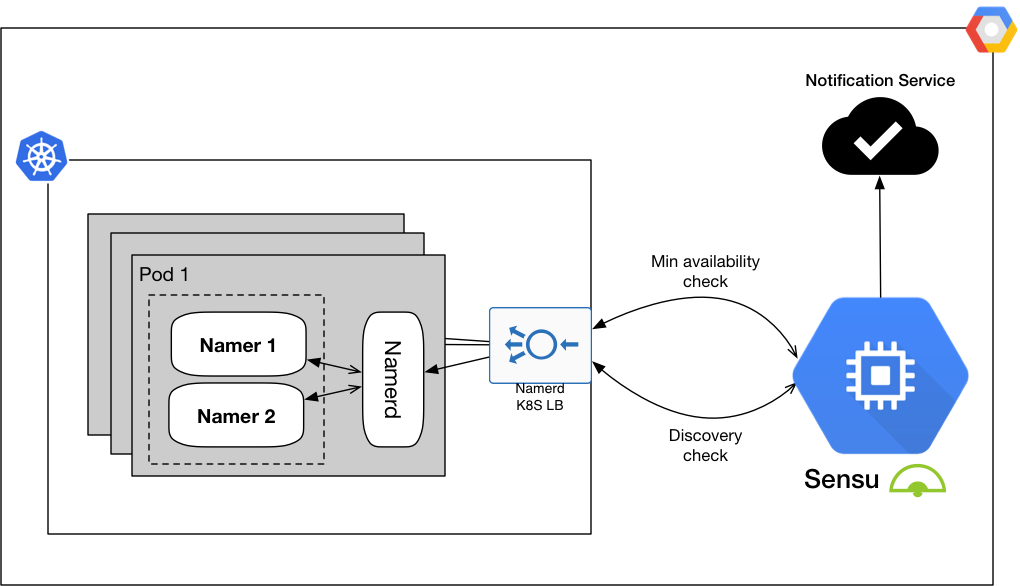
Figure 4: Namerd’s external checks using Sensu
A Sensu check runs on a short interval, every 10 seconds or so, to ensure that at least one backend is available at all times. This Sensu check is a simple HTTP ping against Namerd’s load balancer in Kubernetes. In Figure 4, a Sensu server signals one of its check runners to ping Namerd, and it then reports back to the configured notification system with the result. If consecutive execution of these heartbeats fails, an alert is sent to the notification service for the operations team to investigate further.
We are able to achieve a full health testing of the Namerd service by making each of its replicas independent of each other, mainly by dedicating an instance of each namer to every single one of the replicas. Using this pattern each replica is a full representation of the service itself, and has no other dependency than its configurations. In addition, scalability is also solved for situations where the service needs to scale up to accommodate for high transaction volume.
Discover all the things, all the time
Now that Namerd’s operation is monitored for any possible runtime issues, we can focus on identifying possible discovery issues, i.e. Discovery check in Figure 4. The purpose of this type of monitoring is to test different types of proxies or namers being used by Namerd.
We’ve implemented a custom Sensu check that gets the appropriate dtab configuration for the type of discovery being tested. These dtab configurations define a specific scope, which are also known as a namespace:
GET /api/1/dtabs/<namespace> HTTP/1.1

HTTP/1.1 200 OK
{
    {
        "prefix":"/srv/default",
        "dst":"/#/io.l5d.k8s/prefix/portName"
    },
    {
        "prefix":"/svc",
        "dst":"/srv"
    }
}
Code 1: Get live dtab configuration from Namerd
An example of a namespace could be the dtab configuration for an outgoing Linkerd proxy for the HTTP1 protocol. Given the configuration a namespace from Code 1, a microservice name, and the namespace, the check attempts to discover a microservice by asking Namerd to resolve that name:
POST /dtab/delegator.json HTTP/1.1
{
    "dtab":<dtab_configuration>,
    "namespace":<namespace_name>,
    "path":"/prefix/service"
}

HTTP/1.1 200 OK
{
   "type":"delegate",
   "path":"/prefix/service",
   "delegate":{
      "type":"alt",
      "path":"/srv/prefix/service",
      "dentry":{
         "prefix":"/svc",
         "dst":"/srv"
      },
      "alt":[
         {
            "type":"neg",
            ...
         },
         {
            "type":"leaf",
            "path":"/#/io.l5d.k8s/prefix/portName/service",
            "dentry":{
               "prefix":"/srv/default",
               "dst":"/#/io.l5d.k8s/prefix/portName"
            },
            "bound":{
               "addr":{
                  "type":"bound",
                  ...
               },
               "id":"/%/io.l5d.k8s.daemonset/mesh/...",
               "path":"/"
            }
         },
         ...
      ]
   }
}
Code 2: Resolve a service name with Namerd
In Code 2 API call, Service X was discovered in Namespace A, hence the "type":"leaf" object returned in the body of the response from Namerd. In the same request, all other discovery routes have returned "type":"neg" verifying no path to Service X based on the request body in the API call.
Each namespace used in this check relates to a protocol and router type, incoming/outgoing, set. For example, an HTTP/1.1 protocol has a dtab for sender routers, and another for receiving routers, and for simplicity, this only considers the case where the scope is within one discoverable domain, where external services or entities are not included.
Due to discovery being at the heart of each microservice environment, all discovery checks are treated as critical for the overall discovery health, and alerts are triggered accordingly if issues are not self-corrected in a short amount of time.
Probing watches routing
Just like monitoring discovery with Namerd, monitoring and testing the data plane with the Linkerd proxies in production contains two dimensions, and each gives us a different perspective into how our service mesh proxies are operating. One dimension is the proxies’ running health using an outside watcher, in this case Kubernetes’ health scheduler. The other is, given that the proxies are healthy, can they successfully route requests to proxies on other nodes in the same cluster or across clusters?
The goal of checking proxies’ running health to detect issues that can be solved by restarting the problematic container. So we need to configure a health check that ensures a full loop through the proxy with a response code that is digestible by Kubernetes’ objects, i.e. 200 response is healthy, and non 200 responses mark containers as unhealthy:
GET /admin/ping HTTP/1.1

HTTP/1.1 200 OK
pong
Code 3: Simple health check for each proxy
These health checks can be customized to any complexity based on the infrastructure setup, but in an infrastructure where shallow health checks is all that’s needed to uncover a potential issue, Code 3 shows a simple ping-pong against the proxy container as part of the monitoring check.
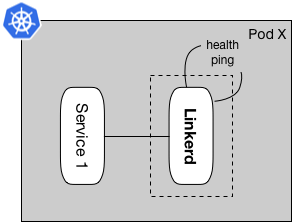
Figure 5: Linkerd sidecar proxy with Kubernetes health probe
Figure 5 shows ping-pong happening on a short interval for each proxy in the infrastructure, irregardless of what container pattern each proxy groups is using.
Checking proxies become more interesting when we started looking at the second dimension mentioned in the beginning of this section, i.e. checking the internal health of routing. In other words, whether the proxies are healthy and capable of routing to different domains, if the external view of routing looks fine:
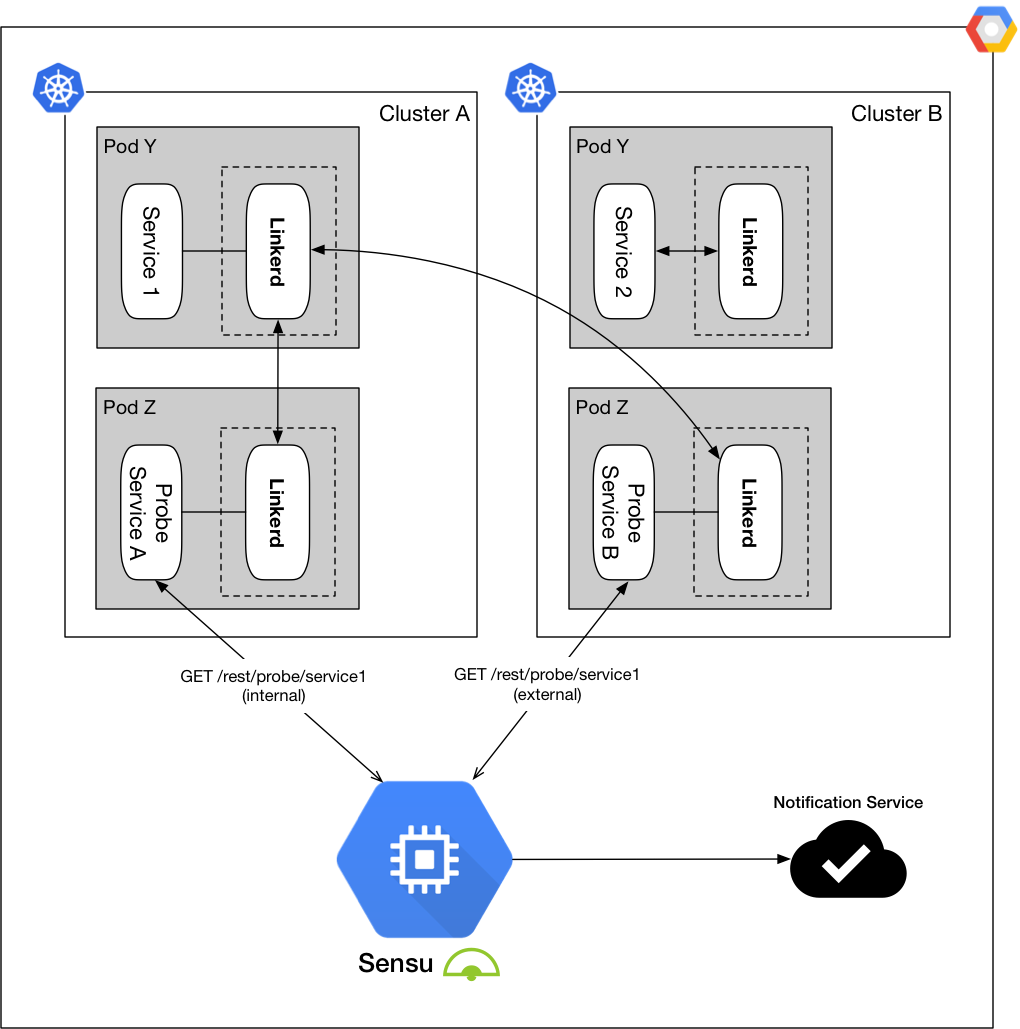
Figure 6: Internal and external probing across two Kubernetes clusters
For a more deterministic probing test, a service is planted in each domain, in this case two different Kubernetes clusters, to internally probe any microservice on demand. In Figure 6, a probe is initiated in Cluster A that instructs the Probe Service A to send a request to its proxy for the probe destination, Service 1. To achieve full domain coverage in this setup, the same probe can be initiated in Cluster B using Probe Service B, where the probe initiates in Cluster B, but ends at Cluster A destined for Service 1. The same pattern can be expanded to any number of clusters, with any number of iterations using the on-demand capabilities of our Probe Service.
Furthermore, in an infrastructure setup where more than one protocol, e.g. HTTP/1.1 or HTTP/2, is applicable, the Probe Service can be configured to probe the destination using any of these protocols in a single probe check:
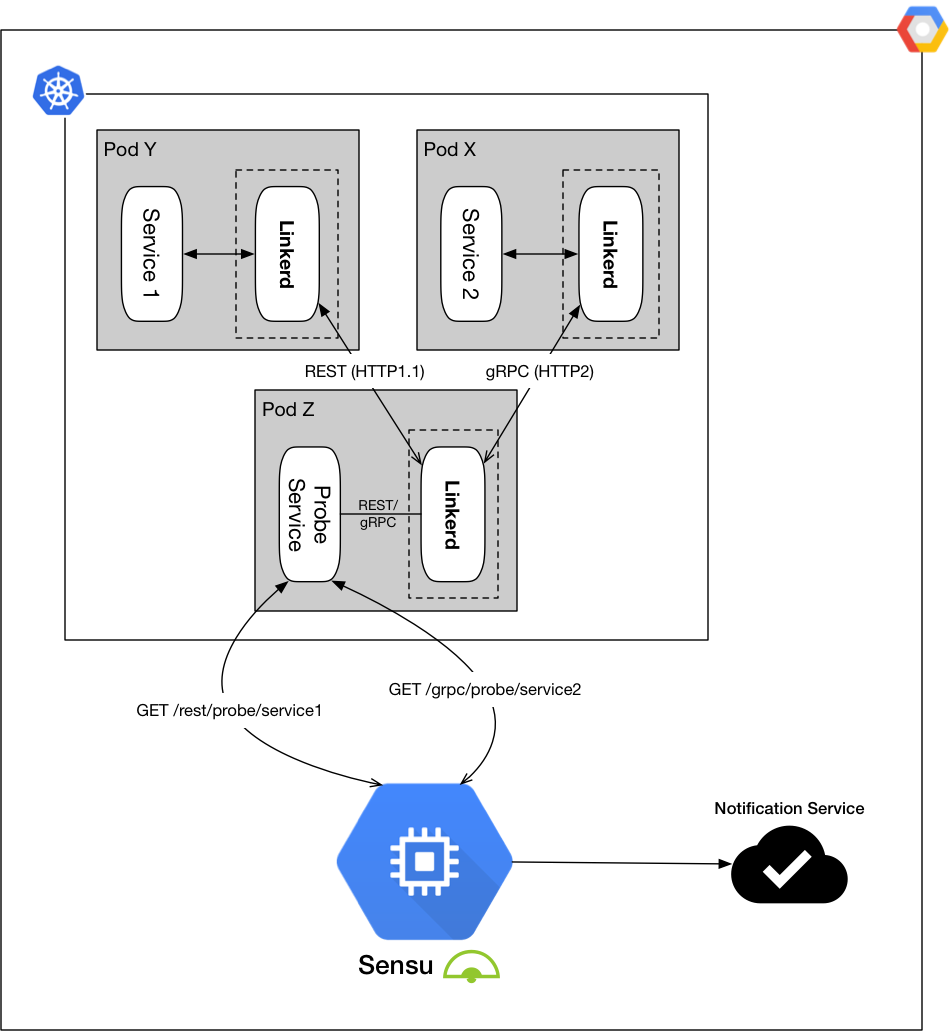
Figure 7: Probing REST and gRPC using the Probe Service
Just like the discovery checks, any of the routing checks are considered critical and trigger notifications or alerts if the issue does not self-heal. Using this end-to-end monitoring style we close the gap on what might go wrong in our infrastructure if something is not operating normally in the case of service mesh.
High availability and beyond
Service mesh is a technology stack that gives us separation of concern in terms of controls, data flows, and load balancing, and with a highly available setup, we’re able to get all the benefits, all the time, with a better guarantee.
In our high availability setup we:
- Separated the control and data planes to minimize the scope of monitoring and make it more deterministic for our monitoring stack.
- Looked at different health checking dimensions and made sure that container operation and feature checking are monitored separately.
- …and using these monitoring setup, we made clear and alertable monitoring events that are actionable.
Given the confidence we get from our highly available service mesh setup, we can migrate more and more microservices to the stack and make use of all the features that come with the stack. Hence, in the next few post in the series, we’re going to dive into how our applications, REST or gRPC, make use of the stack, and how we manage the lifecycle of the stack in WePay’s infrastructure.