Sensu at WePay
My first project here at WePay was to replace our legacy monitoring system Check_MK, with something that we can easily configure and scale to meet the needs of our infrastructure and application services.
Our monitoring needs have outgrown traditional tools like Nagios and Check_MK. Like many companies, we did our due diligence on many SaaS products as well as contemplating the whole “we could just build our own” option for a hot minute.
At the end of the day, we want to be the best at delivering world class payment solutions to platforms and not be the best at writing a monitoring tool. I settled on Sensu after evaluating nearly all the alternatives. Sensu is an open source monitoring platform that supports centralized and distributed monitoring. Sensu is different than the older way of probe/agent monitoring. The architecture is more complex than a system like Check_MK. Sensu uses a Server, Transport Layer, and Clients. Sensu gets into more detail of the basic pattern in their documentation. This pattern works very nicely when it comes to scalability. The downside is that it will come at a cost due to the increased footprint required to meet the needs of a large scale production deployment.
Check_MK works by having the central server establishing a connection to each instance where a Check_MK agent is running, then running the check remotely.
Each instance in our deployment runs a Sensu Client. The client can be configured to run a standalone check or subscription checks. Standalone checks could be used for something that needs to only run on that one instance, e.g.: Check to see if this singleton process is running and report back. Whereas subscription checks follow a “pubsub” pattern.
The Server, Transport Layer, and Client pattern Sensu uses works very nicely when it comes to scalability. The downside is that it comes at a cost due to the increased footprint required to meet the needs of a large scale production deployment.
WePay’s Sensu Architecture
Topology
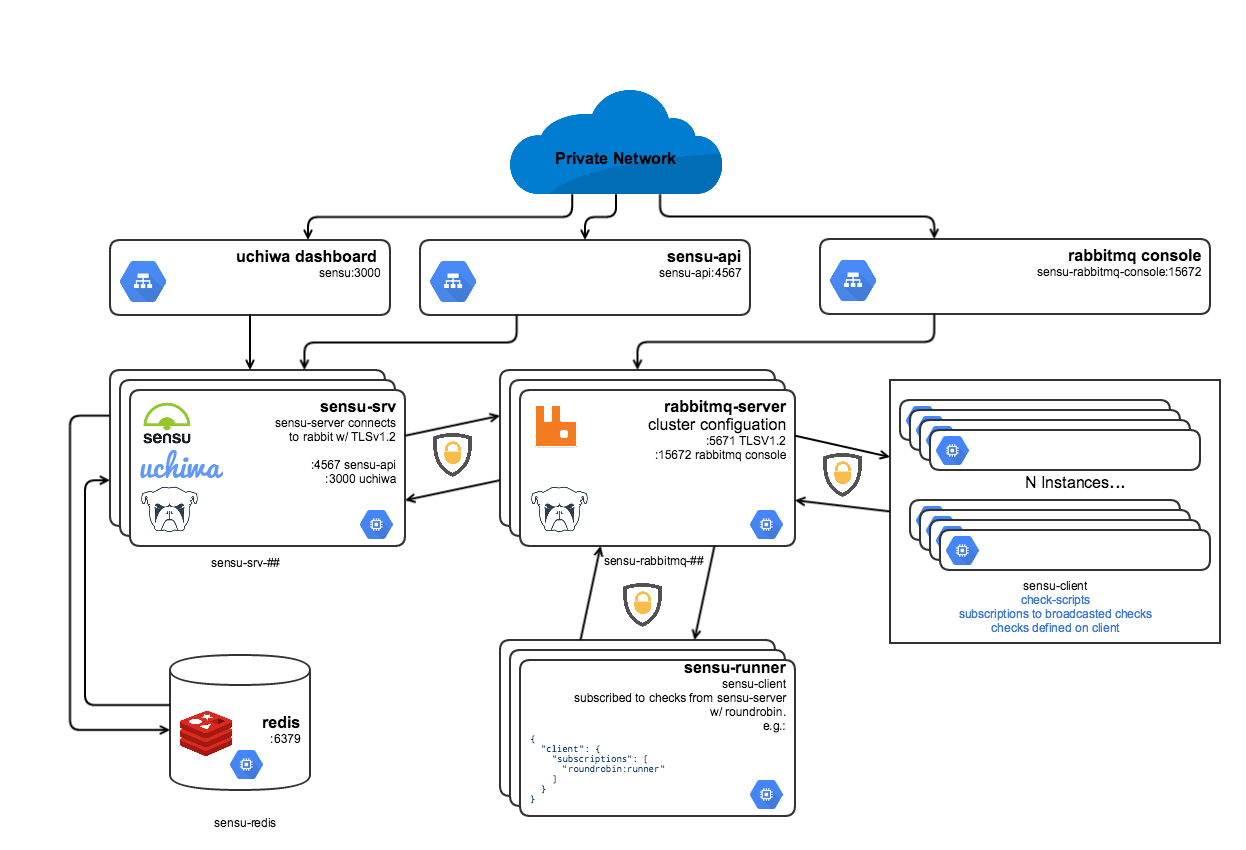
Fig. 1: WePay's Sensu Topology
Our production Sensu footprint is made up of:
- 3 instances running Sensu Server. These instances are responsible for publishing checks into the Sensu/RabbitMQ transport layer, as well as serving the Sensu API and Uchiwa Dashboard for a single pane of glass.
- Redis for persistence of registered clients and any check history.
- 3 RabbitMQ instances running in a cluster.
- Sensu clients on every instance.
- ~ 3-4 instances we call Sensu Runners, for adhoc subscription checks.
- Mmonit is used to keep Sensu server, Sensu api, Sensu client, RabbitMQ and Redis processes running.
The Basics
Internally, Sensu server does its own master election out of the box. This gives us the ability to scale the server layer as needed. The server is responsible for broadcasting all the subscribed checks and handlers for all the check results. Given the size of our production deployment and the things we care about, the servers can get quite busy. We also made the decision to run RabbitMQ in cluster mode for reliability.
Where things get interesting
We use subscription checks almost exclusively. At time of provisioning, Ansible configures the Sensu client with any Google Compute Engine tags defined on the instance.
{
  "client": {
    "name": "ansible_nodename",
    "address": "ansible_eth0.ipv4.address",
    "zone": "hostvars[inventory_hostname].gce_zone",
    "subscriptions": [ "defaults", "gce_tag-01", "gce_tag-02" ]
  }
}
This has proven to be very powerful. In a cloud world with ephemeral instances, we can focus on the definition of the checks to target instances with a similar vocabulary. What this means is if we scale our www instances in Google Cloud, then any checks defined to be run on a instance that is subscribed to www checks will automatically register themselves with Sensu and begin executing the defined checks.
This pattern also works well with our Sensu “Runner” boxes. Essentially we have a class of instances that just run checks. We have them configured using Sensu’s Round-robin client subscriptions. We do this to manage load on the runner boxes. Typically the runner boxes are running status and info checks for things like Memcached and Redis. We have our runners boxes set up in multiple zones. As a result we get the benefit of monitoring the network connectivity between our networks as well.
For round-robin standard checks to be effective you must set the source key in your check to use Sensu’s Proxy Client feature. Without this setting your check’s result history will be split across however many runners you use. This could cause you to not get alerted… which is, needless to say, very bad.
In conclusion, migrating to Sensu has really improved our reliability and trust in our monitoring. Our SREs have more restful nights and we have more control over our infrastructure.