
WePay's Logging Infrastructure
Introduction
Without logs all of us would be stumbling in the dark. We would know that something is wrong, but be unable to figure out exactly what. This article is going to talk about how WePay’s logging infrastructure is set up.
Our centralized logging architecture collects logs from all of our microservices, virtual machines, audit logs from our cloud provider and external vendors, and stores them in a proper format to help search and analyze issues and errors.
WePay uses the ELK stack and Kafka components in it’s core logging pipeline.
In this article we are going to talk about:
-
Log Aggregation
-
Log Processing and Enrichment
-
Log Buffering and Ingestion
-
Storing Logs
-
Searching Logs
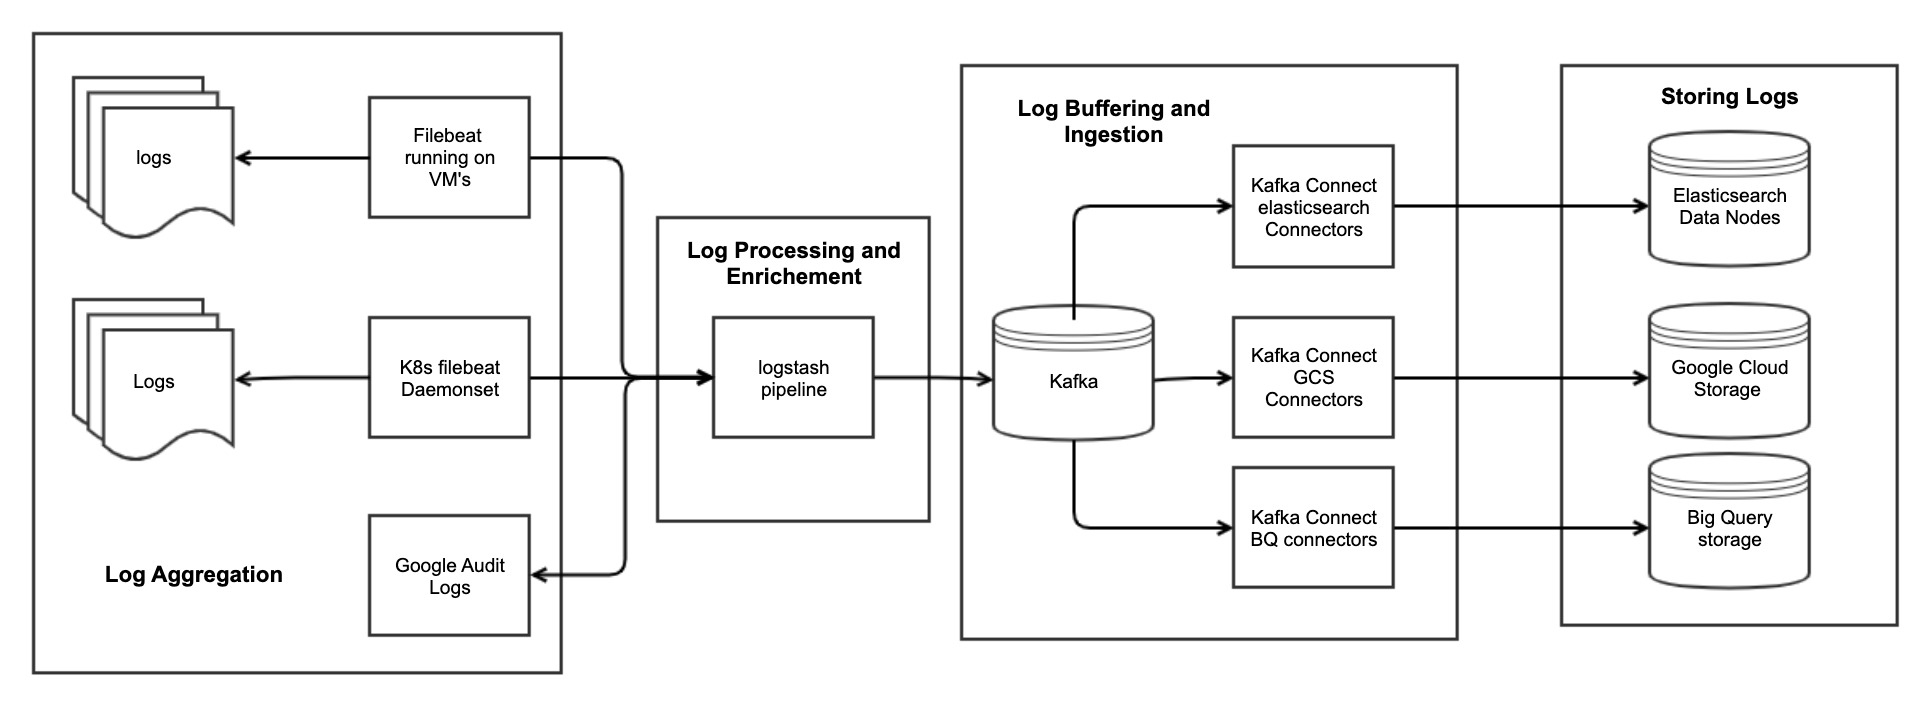
Log Aggregation
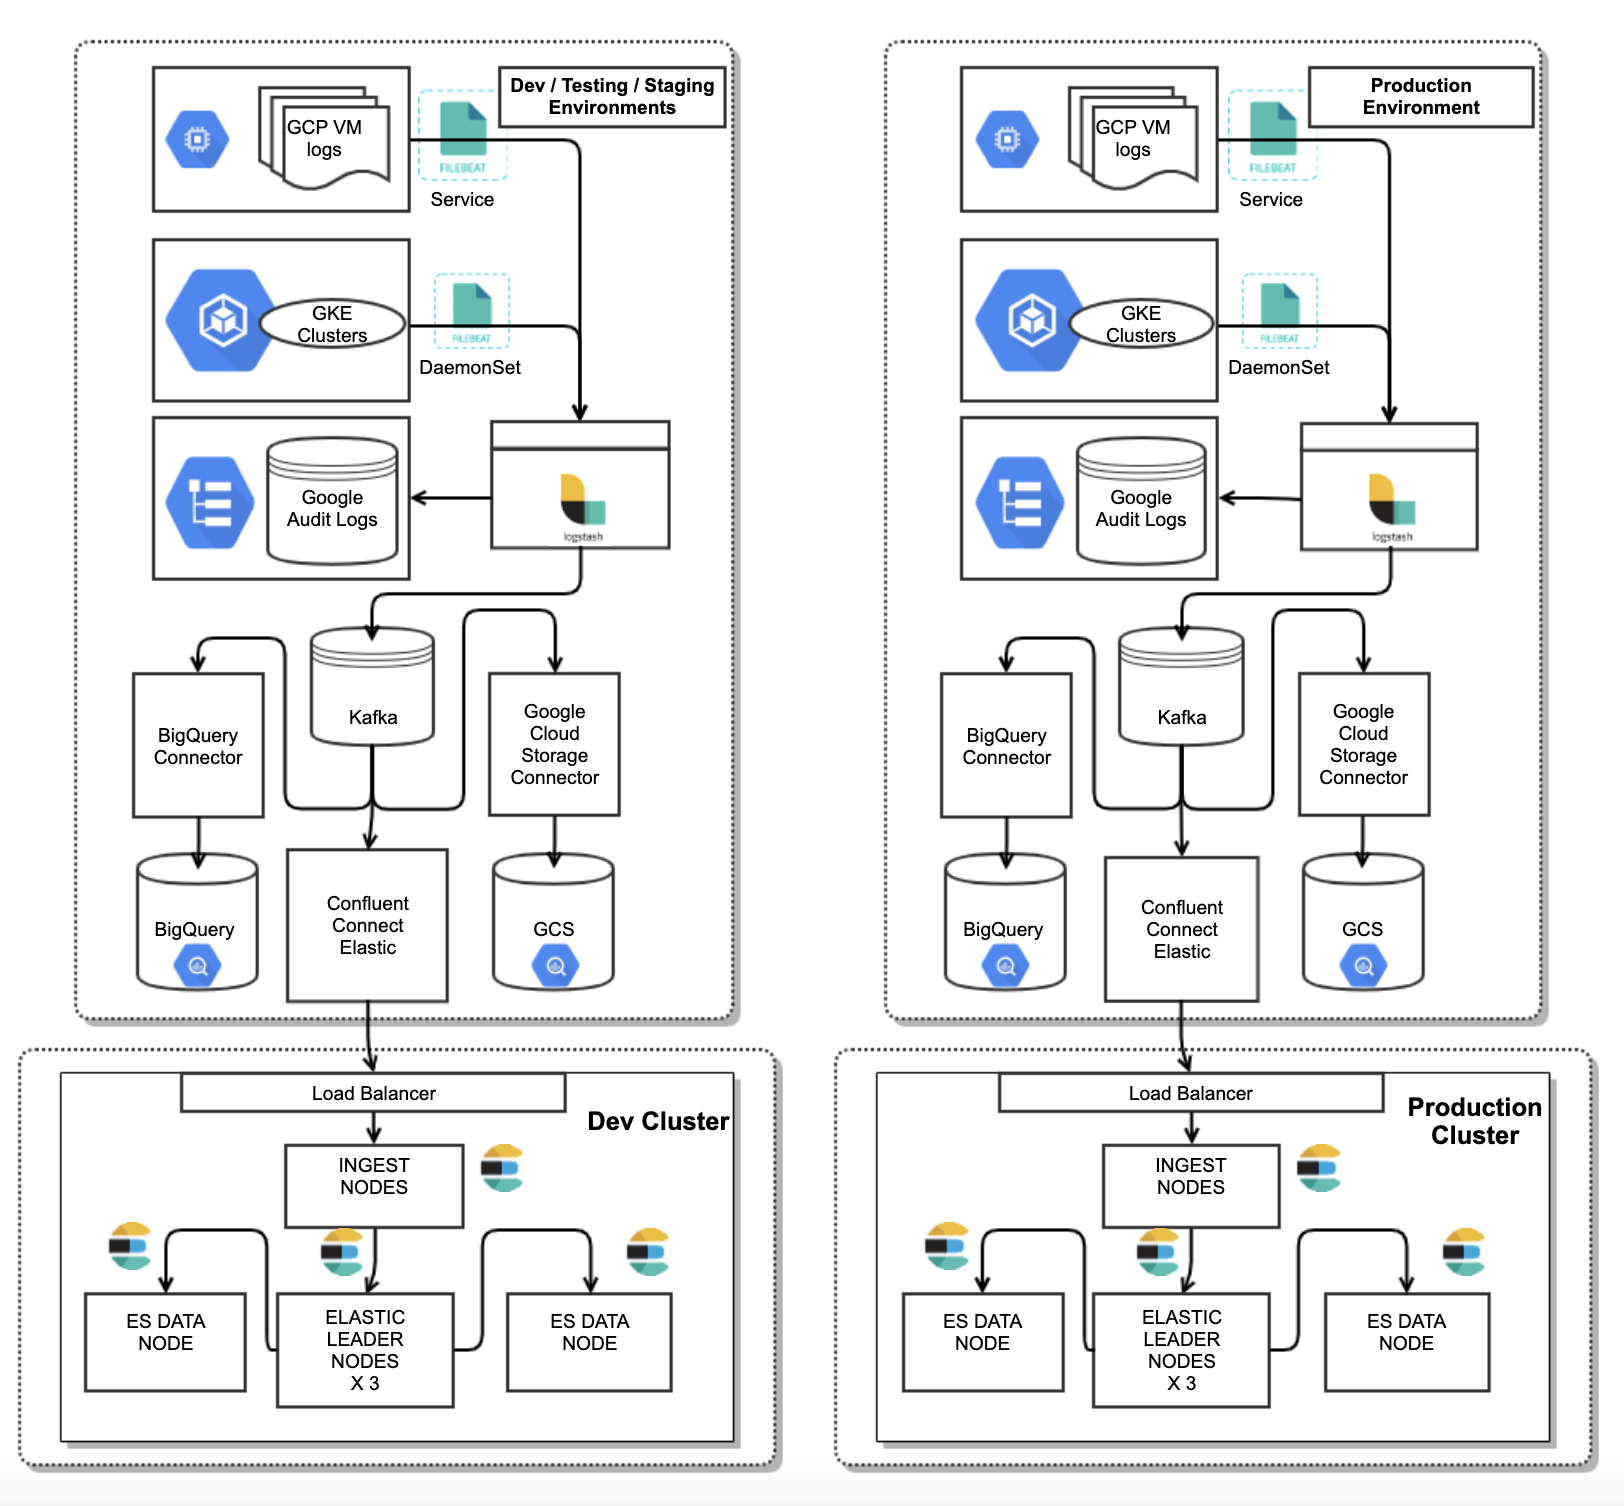
WePay uses filebeat for tailing and shipping logs from VM’s and all our GKE microservices. Filebeat guarantees that events will be delivered to the configured output at least once and with no data loss. Filebeat is able to achieve this behavior because it stores the delivery state of each event in the registry file. In situations where the defined output is blocked and has not confirmed all events, Filebeat will keep trying to send events until the output acknowledges that it has received the events.
Filebeat forwards all logs to logstash for more advanced processing and enrichment.
Log Processing and Enrichment
Logstash filters parse each log event, identify named fields to build structure, and transform them to converge on a common format for more powerful analysis. Logstash helps us in:
-
Deriving structure from unstructured data with powerful grok and mutate filters.
-
Decipher geo coordinates from IP addresses.
-
Anonymize PII data, exclude sensitive fields completely from the logs.
-
Ease overall processing, independent of the data source, format, or schema.
-
Convert json log messages into avro format that match an avro schema so then they can be stored in Kafka.
A raw nginx log message can be parsed into something like:
10.73.1.39 - test [29/May/2021:23:10:31 +0000] "GET /v1/sys/health HTTP/1.0" 200 293 "-" "-" "-"

Client IP : 10.73.1.39
User : test
Timestamp : 29/May/2021:23:10:31
Method: GET
URL: /v1/sys/health
HTTP_Version : 1.0
Response : 200
Request Bytes : 293
WePay relies on Avro messages because the structure of logs changes over time. If a “string” field is converted into an “int” field we would have elasticsearch mapping conflicts, Avro schemas help ensure that we don’t have conflicts in our ElasticSchema’s.
Log Buffering and Ingestion
Buffering
Sometimes applications log at unprecedented levels, during incidents, incorrect logging format, or when there are bugs in the application. These sudden log surges can overwhelm our logging infrastructure. To protect Elasticsearch from such cases of data surges. WePay uses Apache Kafka to buffer logs. In our logging pipeline, logstash forwards all the logs to Kafka in Avro format.
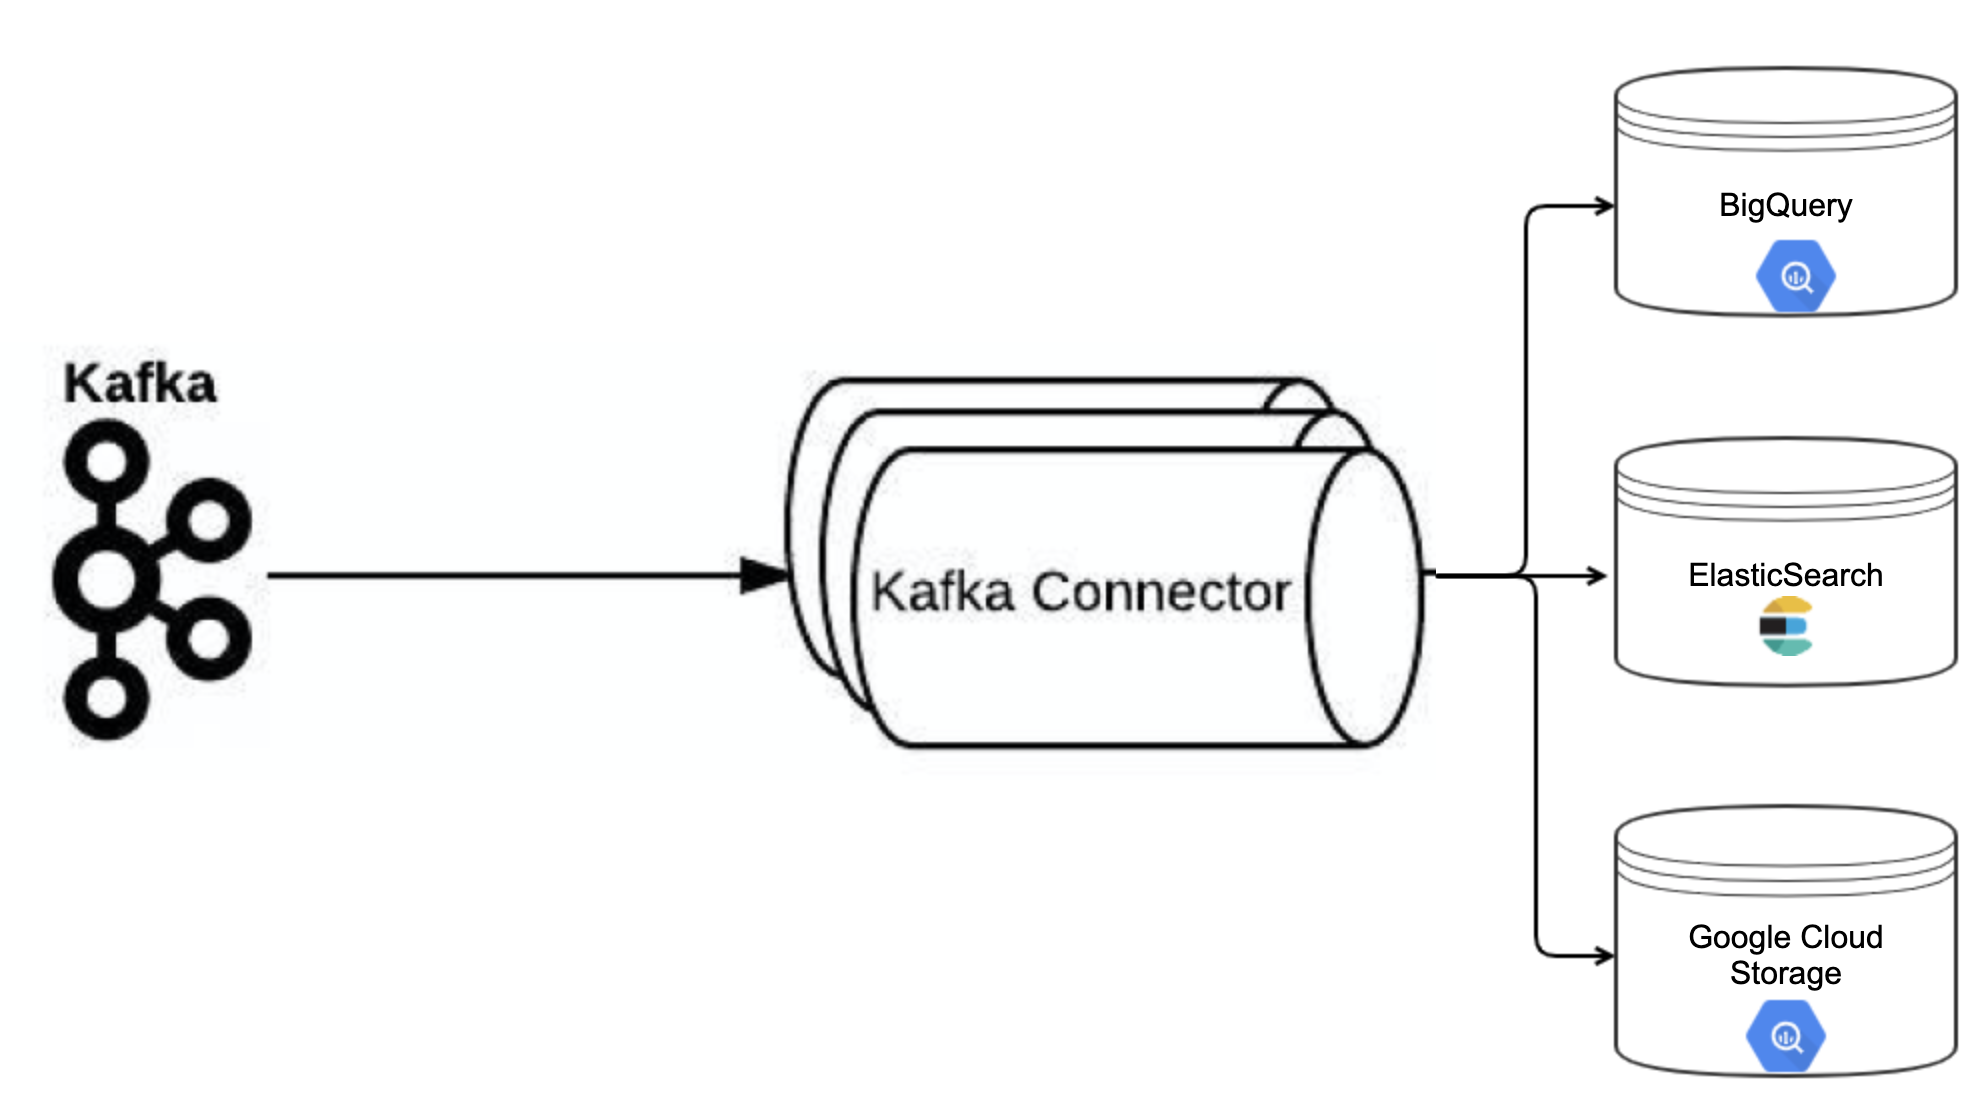
Ingestion
WePay uses light weight Confluent Kafka Connectors for ingesting logs into Elastic/Google BigQuery/Google Cloud Storage Buckets. We use 3 kind of connectors:
-
Kafka Connect Elasticsearch to ingest logs into our elastic Cluster
-
Our inhouse developed Google BigQuery Sink Connector to ingest logs into Google’s BigQuery.
-
GCS Sink Connector to ingest logs into Google Cloud Storage Buckets.
Storing Logs
WePay, as a payments company, is subject to PCI DSS audits. PCI requirements state that logs must be retained for at least one year. Ninety days of logs must also be available for immediate analysis. We store our logs in 3 places:
-
Elasticsearch - 90 days of retention policy for immediate analysis.
-
Google Big Query - Logs are retained for long-term per regulatory and compliance requirements For analysis when we want to look for historic data ( data not in elastic because of retention policies ). With BigQuery’s powerful query interfaces we can structure and search for logs as needed.
-
Google Cloud Storage - Logs are retained for long-term per regulatory and compliance requirements. We mainly store logs in GCS to backfill Google’s BQ in times when the connector to BigQuery is broken.
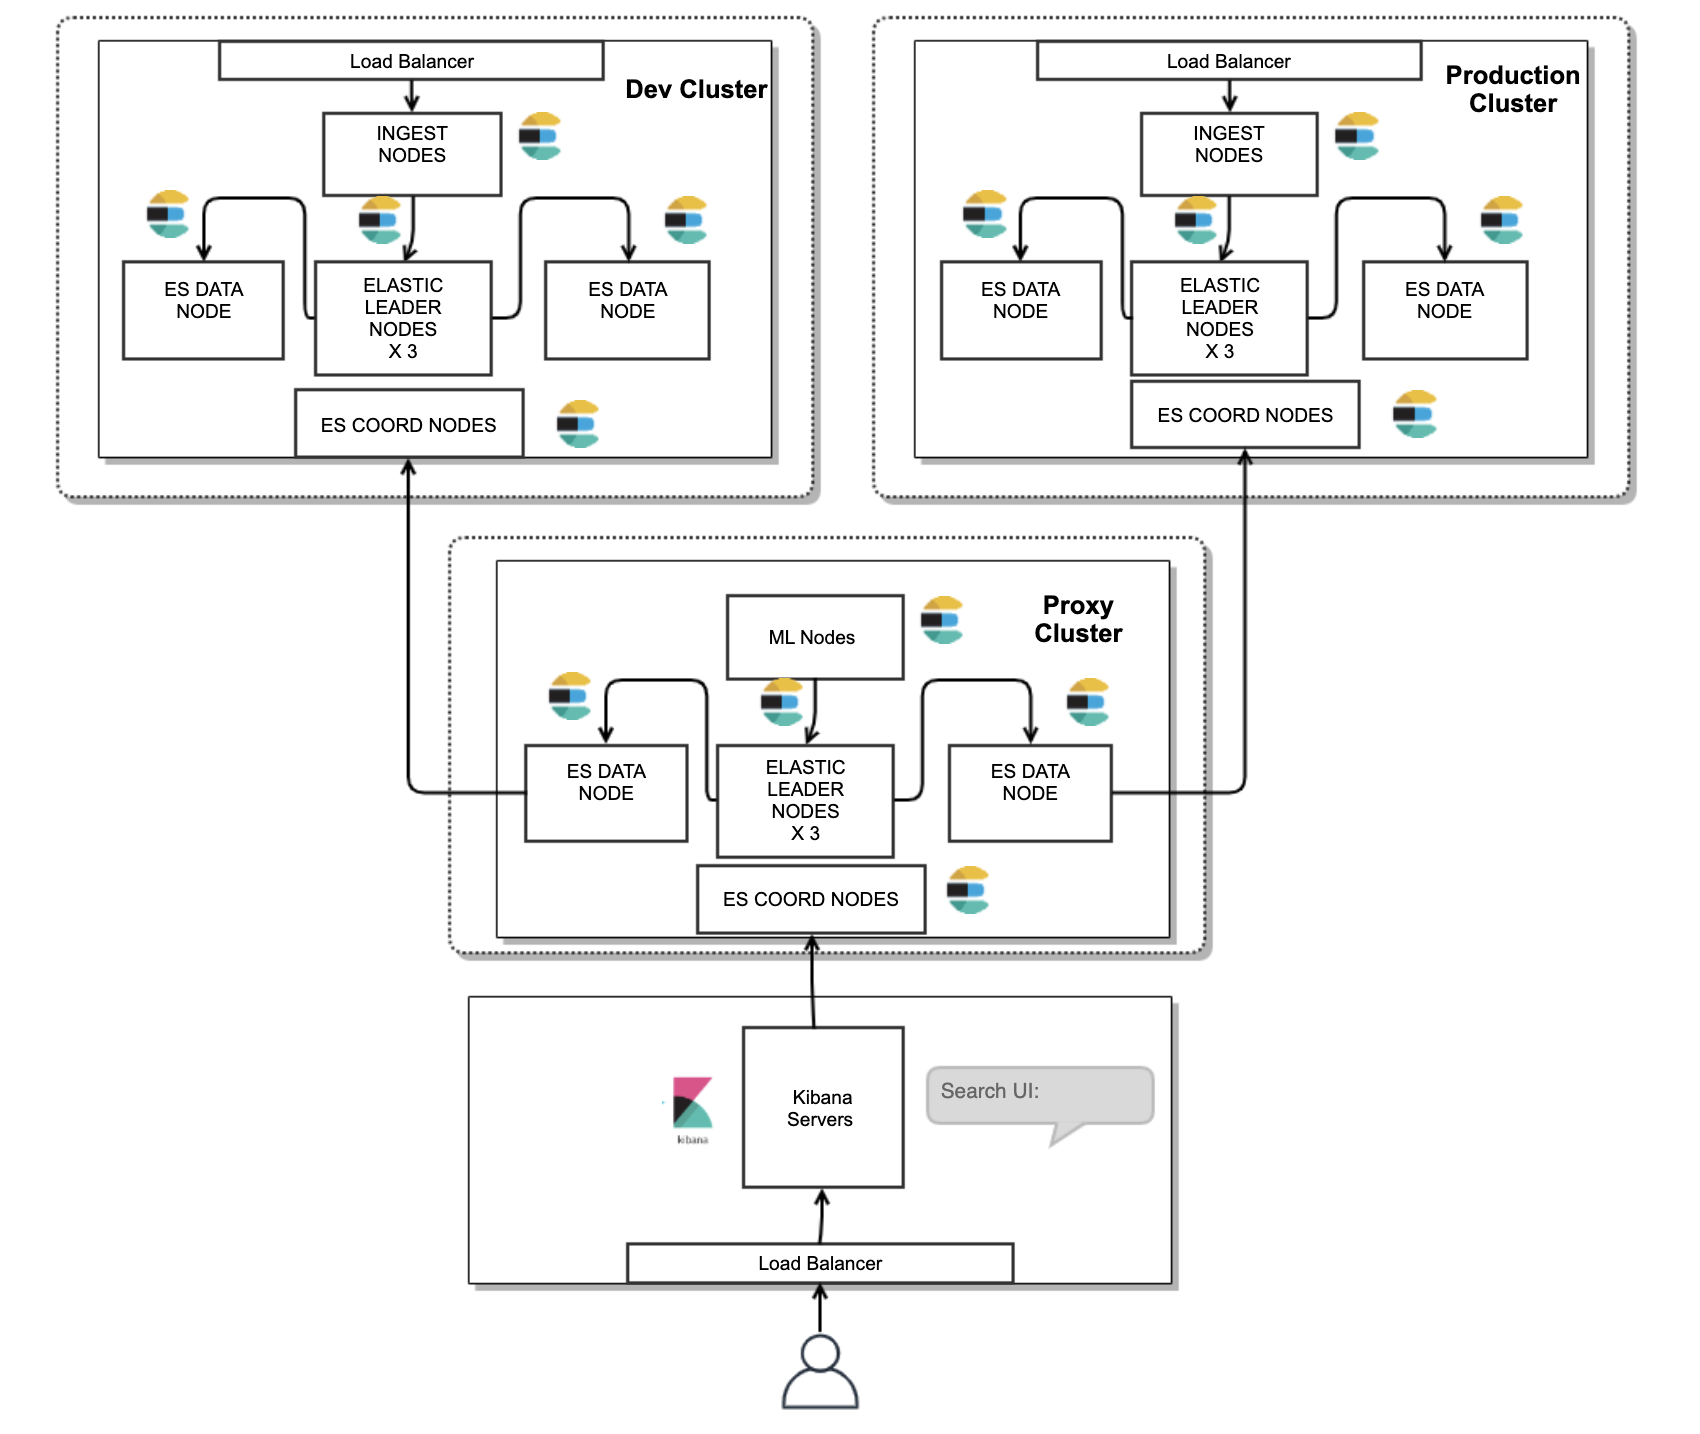
At WePay we have 4 environments: dev, testing, staging and production. Each environment generates a lot of logs. We have two elastic clusters to store these logs:
-
A Dev Elastic cluster for development, Testing and staging environment logs.
-
A production Elastic cluster for our production environment logs.
Setting up two elastic clusters had the following advantages:
-
If an application in dev or testing environments goes rogue and starts logging at unprecedented levels because of a bug or incorrect logging format, this will impact only our dev cluster.
-
When upgrading elastic to a new version, we can first upgrade the dev cluster; if we encounter any backward compatibility issues, only the dev cluster would be impacted. The production cluster remains safe.
Hot Warm Cold Architecture
With the amount of data that we get, we had to think upstream while designing the data retention and index life cycle management policies.
There are 3 kinds of elastic data nodes setup:
-
Hot nodes which will have all new indexes, and will get extensive reads and writes. This is where all new data will be indexed. These are CPU extensive nodes.
-
Warm nodes will host old indexes and will get all reads and no writes.
-
Cold nodes will host old indices and will barely get any reads.
Elastic’s ILM gives us the ability to manage indexes by triggering actions when conditions are met. With ILM policies we have something like:
-
For creating a new index and indexing all data use hot nodes. The ILM policy will start by setting the index priority to a high value for the indices so that hot indexes will recover before other indexes in the event of failures.
-
After the index has completed one week of it’s time in a hot node, merge the number of segments to 1 and move it to the warm node.
-
After the index is completed 1 month of its time in the warm node, freeze the index and move it to the cold node.
-
Delete the index after 3 months.
Searching - Kibana
In the previous section, we talked about how we have two elastic clusters. We didn’t want two Kibana’s for searching logs in each cluster, so we decided to go with cross cluster search.
We achieved this by creating a third elasticsearch cluster, that sends requests to the dev and production clusters. This architecture has several benefits:
-
All security roles and access permissions for end users are defined in this cluster, hence we avoid creating duplicate security mappings in dev and production logging clusters.
-
Licensed Machine learning nodes run only on this proxy cluster to gather insights from the logs stored in Dev and Production Cluster.
-
A Proxy cluster can help set search thread throttling.
-
An end user in Kibana with superuser permissions won’t be able to make changes to Dev and Production clusters, hence increasing the overall security.
Future Work
-
We aim at getting APM data from our applications into elasticsearch. This will help us to strongly correlate logging events with APM insights.
-
We plan on setting up Cross Cluster Replication across multiple regions with the active passive model, and switching between each other during region failures for better fault tolerance.
-
We plan on using Frozen Tier for elastic, for searching for longer duration of logs ( 90+ days ) by referencing storage buckets.
Conclusion
The elastic clusters have been stress tested to handle upto 80k logs per second. Separating the Dev and Production elastic clusters has helped us protect the Production logging pipeline from Dev environment data surges. The log pipeline to BigQuery makes sure we have longer retention of data at low cost. The Proxy cluster along with Cross Cluster Search has helped us protect the elasticsearch data in Dev and Production clusters by having a single point authenticating and surfacing all search requests.